Image Details
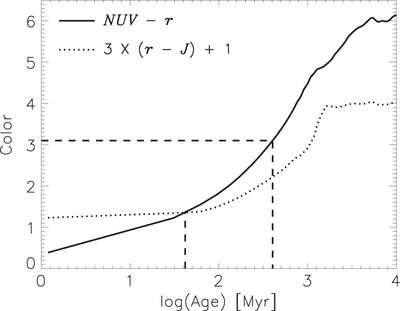
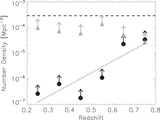
Caption: Figure 11.
Color evolution of a passively evolving galaxy as a function of time after the cessation of star formation based on the FSPS model. The NUV − r and 3 × (r − J) + 1 colors are plotted by the solid and dotted lines, respectively. The dashed lines at log(Age) ∼1.6 and ∼2.6 indicate when the passively evolving galaxy meets the ﹩({NUV}-r)\gt 3\times (r-J)+1﹩ and ﹩({NUV}-r)\gt 3.1﹩ quiescent galaxy classification criteria of Ilbert et al. (2013), respectively.
Other Images in This Article

Show More
Copyright and Terms & Conditions
© 2016. The American Astronomical Society. All rights reserved.
Copyright ©
2025 Astronomy Image Explorer. All Rights Reserved.