Image Details
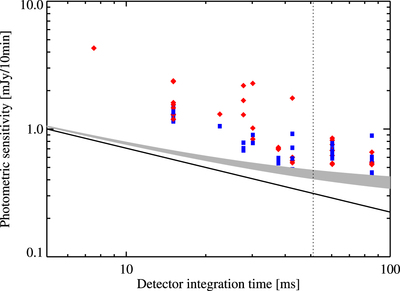
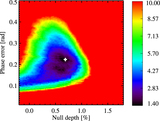
Caption: Figure 13.
Measured photometric sensitivity for various representative nights of the commissioning phase (same notation as in Figure 10). The solid line shows the theoretical sensitivity for readout noise only (i.e., 400 e−/pixel, Hoffmann et al. 2014), while the gray shaded area shows the sensitivity for readout noise and background noise (assuming a thermal background flux in the range of 1–2 Jy pixel−1). The vertical dashed line indicates the integration time for which the background noise dominates the readout noise (assuming a thermal background level of 1.5 Jy pixel−1).
Other Images in This Article

Show More
Copyright and Terms & Conditions
© 2016. The American Astronomical Society. All rights reserved.
Copyright ©
2025 Astronomy Image Explorer. All Rights Reserved.