Image Details
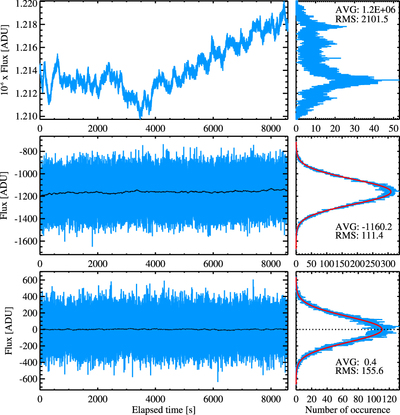
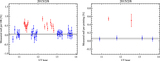
Caption: Figure 7.
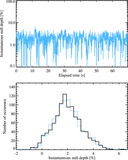
Top: example of on-sky raw thermal background measurements obtained in the N′ band with the telescope pointing at an empty region of the sky and covering approximately 15 degrees of elevation change during the whole duration of the sequence. The left panel shows the flux integrated over a photometric aperture of 8 pixels in radius while the right panel shows the corresponding distribution. Middle: same measurements after subtraction of simultaneous background measurements (left). The corresponding distribution (right) is now Gaussian and shows a relatively large offset. The black line represents a running average of 100 s to better show the low-frequency drift due to slowly changing instrumental background. Bottom, same measurements after subtraction of simultaneous background measurements and nod subtraction (left). For this example, nod subtraction has been performed at the maximum frequency (i.e., using adjacent frames). The corresponding distribution (right) is now Gaussian and centered on 0. These data have been obtained using an integration time of 28 ms (on 2014 May 14).
Other Images in This Article

Show More
Copyright and Terms & Conditions
© 2016. The American Astronomical Society. All rights reserved.