Image Details
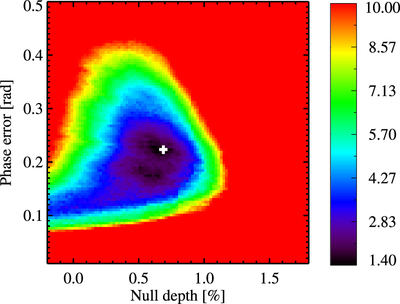
Caption: Figure 9.
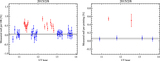
Example of ﹩{\chi }_{r}^{2}﹩ map represented as a function of null depth and rms phase error σϕ (﹩{\chi }_{r}^{2}﹩ minimized along the mean phase direction). The region where ﹩{\chi }_{r}^{2}\gt 10﹩ has been set to 10 to emphasize the low ﹩{\chi }_{r}^{2}﹩ region. The position of the best-fit model is represented by the white cross.
Other Images in This Article

Show More
Copyright and Terms & Conditions
© 2016. The American Astronomical Society. All rights reserved.
Copyright ©
2025 Astronomy Image Explorer. All Rights Reserved.