Image Details
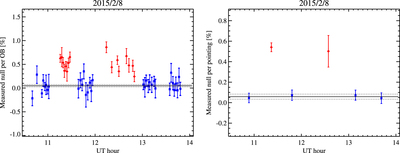
Caption: Figure 10.
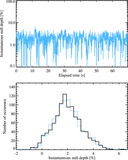
Left: null depth measurements per OB as a function of UT time obtained on 2015 February 8. The blue squares show the calibrator measurements, while the red diamonds represent the β Leo measurements. The estimated instrumental null floor is represented by the solid black line and the corresponding 1σ uncertainty by the dotted lines. Right: corresponding null depth measurements per pointing (same notation). The longer time spent to acquire the second β Leo pointing increased the background bias and hence the dispersion of the null depth measurements per OB in the left-hand plot. This effect results in a larger systematic error for this pointing (see Table 1) and explains the larger error bar in the right-hand plot.
Other Images in This Article

Show More
Copyright and Terms & Conditions
© 2016. The American Astronomical Society. All rights reserved.