

Image Details
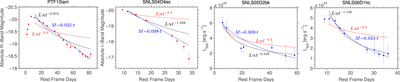
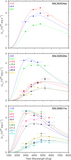
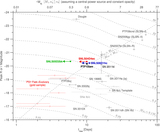
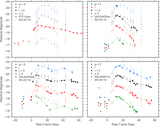
Caption: Figure 18.
Left to right: fits to the decline of the R-band light curve of PTF10iam, the r-band light curve of SNLS04D4ec, and the bolometric light curves of SNLS05D2bk and SNLS06D1hc. All light curves decline faster than L∝t−0.3 (red), expected for shock breakout in a wind, and are consistent with either a more rapid power-law decline (black) or an exponential decline (blue), typical of light curves powered by radioactive decay.
Other Images in This Article
Show More
Copyright and Terms & Conditions
© 2016. The American Astronomical Society. All rights reserved.

Copyright ©
2026 Astronomy Image Explorer. All Rights Reserved.
