

Image Details
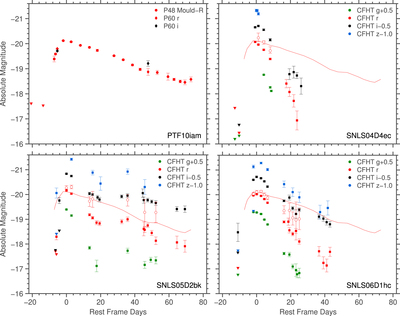
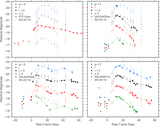
Caption: Figure 2.
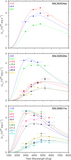
Light curves (in observed filters) of our four rapidly rising luminous transients. Triangles denote 3σ non-detection upper limits. The solid line represents the PTF10iam light curve for comparison to the SNLS events. Empty circles in the SNLS light curves are the expected magnitudes after K correction to the PTF Mould R filter in the PTF10iam rest frame (i.e., these points are the ones that can be directly compared to the solid line). The K corrections are based on the blackbody fits performed for epochs with three or more bands observed within 0.5 days (see the text for details). All four events exhibit a rapid ≲10 day rise to a luminous (≈ −20 mag) peak. SNLS05d2bk shows a second peak approximately 40 days after the main peak.
Other Images in This Article
Show More
Copyright and Terms & Conditions
© 2016. The American Astronomical Society. All rights reserved.

