

Image Details
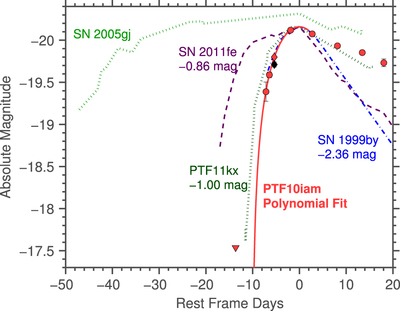
Caption: Figure 14.
Early light curve of PTF10iam (red circles are detections and the triangle is an upper limit) and the parabolic fit to the pre-peak data used to infer the rise time (solid red line). We compare the rise of PTF10iam to those of the normal Type Ia SN 2011fe (dashed purple line; data from Vinkó et al. 2012; distance modulus from Lee & Jang 2012), the 91bg-like SN 1999by (dotted–dashed blue line; data from Garnavich et al. 2004; distance modulus from NED), the Ia–CSM PTF11kx (dotted dark green line; Firth et al. 2015)—all shifted in brightness to match the peak of PTF10iam—and the Ia–CSM SN 2005gj (dotted light green line; Aldering et al. 2006). PTF10iam has a faster rise compared to SN 2011fe and SN 2005gj. The rises of PTF10iam, SN1˙999by, and PTF11kx are similar, but their peak magnitudes are very different. If this difference were due to interaction power it should have imprinted strong CSM signatures in the spectrum.
Other Images in This Article
Show More
Copyright and Terms & Conditions
© 2016. The American Astronomical Society. All rights reserved.

