

Image Details
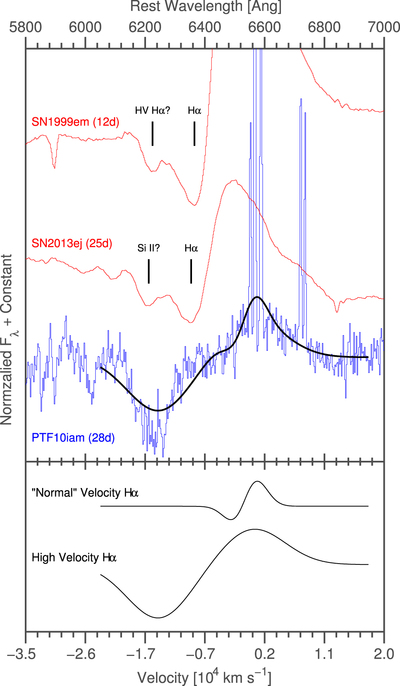
Caption: Figure 11.
Hα region in PTF10iam (blue; spectrum taken 28 rest frame days after peak) compared to spectra of SN 1999em (Leonard et al. 2002) and SN 2013ej (Valenti et al. 2013; red) after removing a low-order polynomial from each spectrum. The narrow emission lines in the PTF10iam spectrum are from the host galaxy. The absorption feature at ≈6200 Å could be related to high velocity hydrogen, a sign of possible CSM interaction (as interpreted by Chugai et al. 2007 for a later appearance of a similar feature in SN 1999em), or to Si II (as interpreted by Valenti et al. 2013 for SN 2013ej). In PTF10iam, however, this feature is much deeper. We plot the best fit to a sum of four Gaussian functions (black), two representing a “normal” Hα P-Cygni profile and two representing a high velocity P-Cygni profile. The profiles provide a reasonable fit to the features, consistent with the high velocity Hα interpretation, but the absorption depth would be greater than any previously observed high velocity hydrogen feature.
Other Images in This Article
Show More
Copyright and Terms & Conditions
© 2016. The American Astronomical Society. All rights reserved.

