

Image Details
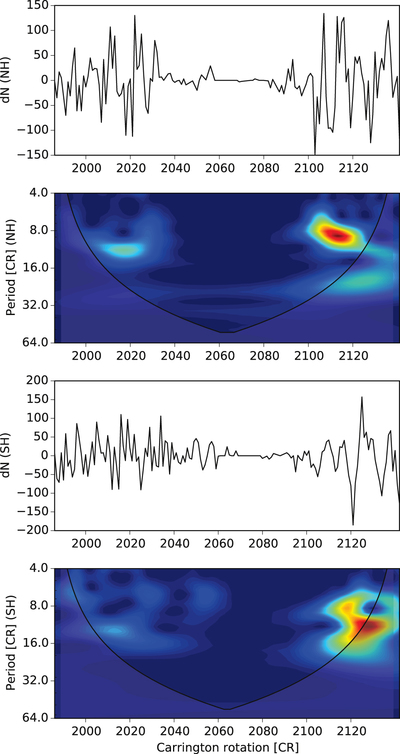
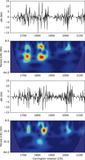
Caption: Figure 6.
Same statistics as in Figure 6, but the data was taken from the RHESSI catalog. The bottom axis is time in CR. The indicated period covers the whole RHESSI database from 2002. The meaning of the color codes are the same, the red contour encloses regions of greater than 95% confidence. The gray faded regions on either end of the figures indicate the cone of influence (COI) where the edge effect become significant for that reason all of the found peaks under the COI has been omitted.
Other Images in This Article
Copyright and Terms & Conditions
© 2016. The American Astronomical Society. All rights reserved.

Copyright ©
2026 Astronomy Image Explorer. All Rights Reserved.
