

Image Details
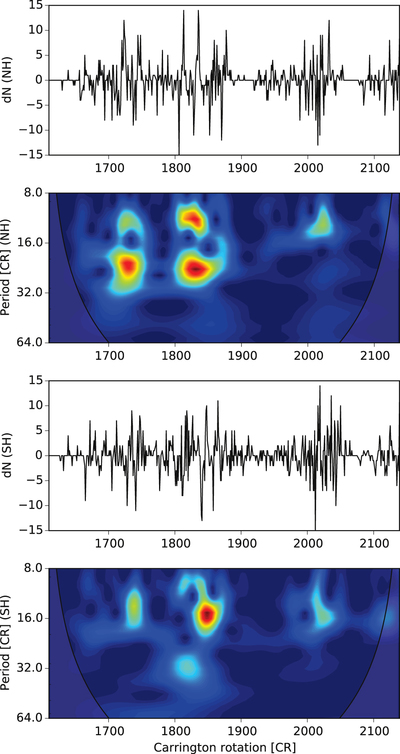
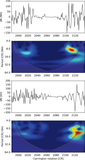
Caption: Figure 5.
Temporal distribution of the solar flares near to the dominant AL. The smoothed solid black lines of the first and the third subplots indicate the time variation of the GOES solar flare variance. Below those plots, continuous wavelet transforms of the time series are presented. The first and the second subplots contain data from the northern hemisphere (NH) and the last two subplots show the southern hemisphere (SH). The bottom axis is time in CR for each subplot. The red contours enclose regions of greater than 95% confidence. The gray faded regions on either end of the figures indicate the cone of influence (COI) where the edge effect becomes significant. For that reason, all of the found peaks under the COI has been omitted.
Other Images in This Article
Copyright and Terms & Conditions
© 2016. The American Astronomical Society. All rights reserved.

