

Image Details
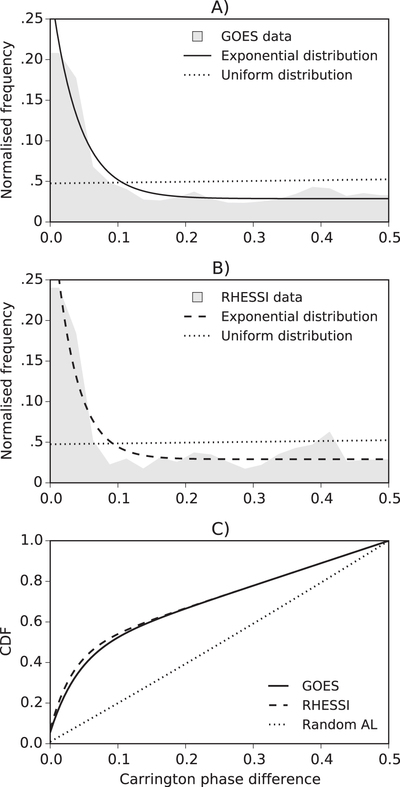
Caption: Figure 4.
Spatial distributions of the parameter ﹩\delta \psi ﹩. Panel (A) shows the spatial distribution of GOES flares with respect to the AL, represented by the gray area. The solid line is the fitted exponential model distribution and the dotted line means the uniform distribution based on random AL. Panel (B) represents the same statistics, but the RHESSI flare list has been used. The dashed line is the fitted exponential model distribution and the dotted line means the uniform distribution based on random AL. The last figure (Panel (C)) shows the cumulative distribution of the fitted model distributions.
Other Images in This Article
Copyright and Terms & Conditions
© 2016. The American Astronomical Society. All rights reserved.

Copyright ©
2026 Astronomy Image Explorer. All Rights Reserved.
