

Image Details
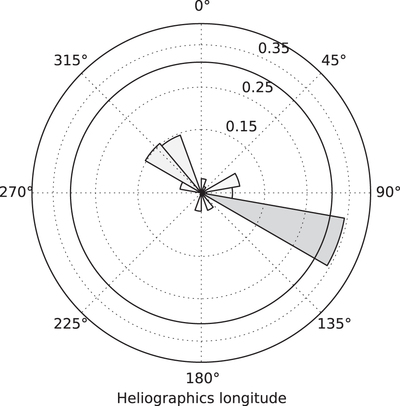
Caption: Figure 1.
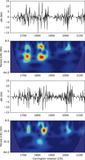
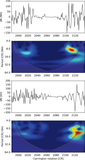
Example for the spatial distribution of the quantity W in the CR 1718. The black line represents the 3σ significance limit. The largest peak represents the AL. In this CR, at the other side (roughly 180° phase shift), the weaker and more disperse peaks correspond to the co-dominant AL.
Other Images in This Article
Copyright and Terms & Conditions
© 2016. The American Astronomical Society. All rights reserved.

Copyright ©
2026 Astronomy Image Explorer. All Rights Reserved.
