

Image Details
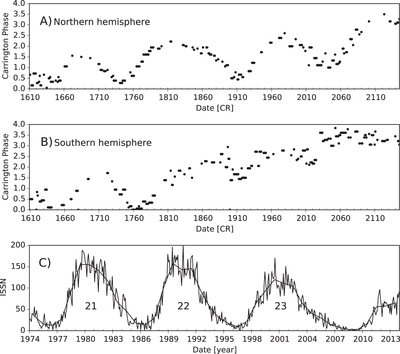
Caption: Figure 3.
Activity maps for whole the DPD-era (1974–2014). Panel (A) shows the migration of the AL on the northern hemisphere. The black markers mean the longitudinal belts of most enhanced sunspot activity (AL) in certain CRs. Panel (B): the same as Panel (A), but for the southern hemisphere. Panel (C) represents the temporal variation of the International Sunspot Number (ISSN). The numbers of the solar cycles are also marked.
Other Images in This Article
Copyright and Terms & Conditions
© 2016. The American Astronomical Society. All rights reserved.

Copyright ©
2026 Astronomy Image Explorer. All Rights Reserved.
