Image Details
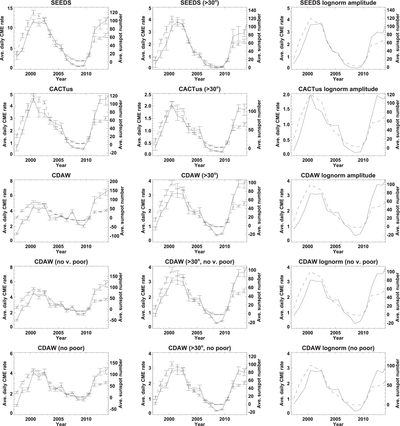
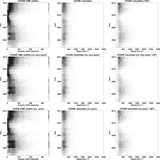
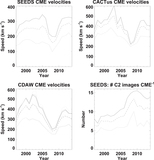
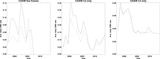
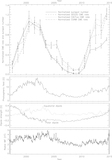
Caption: Figure 9.
Average daily CME rates from SEEDS (top row), CACTus (second row), and CDAW (3rd–5th rows) with all cases included (3rd row), very poor cases excluded (4th row), and poor and very poor cases excluded (5th row). In the first column, CMEs of all angular widths are included, whereas in the middle column only CMEs with angular widths >30° are included. The error bars indicate the standard deviations of the annual means. The right column shows the amplitude of Equation (1) fitted to the annual distribution of detections with angular widths >30°. The average monthly sunspot number is overplotted in dashed curves for comparison.
Other Images in This Article
Copyright and Terms & Conditions
© 2015. The American Astronomical Society. All rights reserved.