Image Details
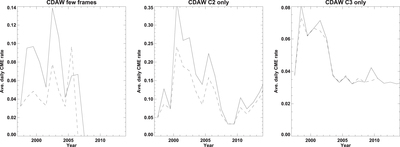
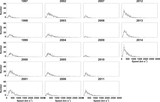
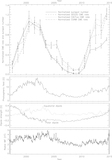
Caption: Figure 10.
Average daily CME rates from CDAW where the CME appeared in only 2 or 3 LASCO images (left), only in C2 images (middle), and only in C3 images (right). Poor and very poor events are not included. The solid lines show the rates for all CMEs and the dashed lines show the rates for CMEs with angular widths >30°.
Other Images in This Article
Copyright and Terms & Conditions
© 2015. The American Astronomical Society. All rights reserved.
Copyright ©
2025 Astronomy Image Explorer. All Rights Reserved.