Image Details

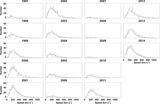
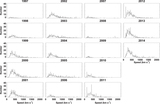
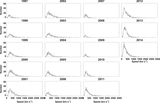
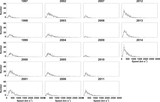
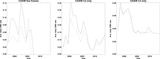
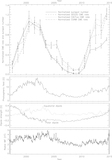
Caption: Figure 5.
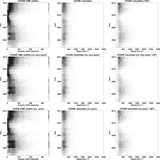
Stacked annual histograms of CME angular widths (left) and angular widths for all detections (middle) and for detections with angular width >30° (right), from the SEEDS (top), CACTus (middle), and CDAW (bottom) databases. The dotted lines in the left plots indicate the angular width cutoff at 30°, below which the detections are excluded from the right plots.
Other Images in This Article
Copyright and Terms & Conditions
© 2015. The American Astronomical Society. All rights reserved.
Copyright ©
2025 Astronomy Image Explorer. All Rights Reserved.