Image Details

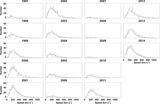
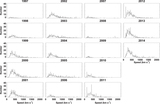
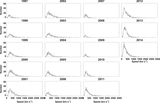
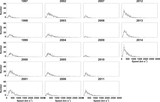
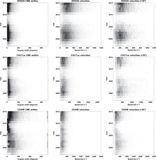
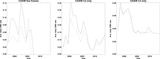
Caption: Figure 7.
Stacked annual histograms of CME angular widths (left), angular widths for all detections (middle), and for detections with angular widths >30° (right), from the CDAW database. All detections are included in the top plots, very poor detections are excluded from the middle plots, and poor and very poor detections are excluded from the bottom plots. The dotted lines in the left plots indicate the angular width cutoff at 30°, below which the detections are excluded from the right plots.
Other Images in This Article
Copyright and Terms & Conditions
© 2015. The American Astronomical Society. All rights reserved.
Copyright ©
2025 Astronomy Image Explorer. All Rights Reserved.