Image Details
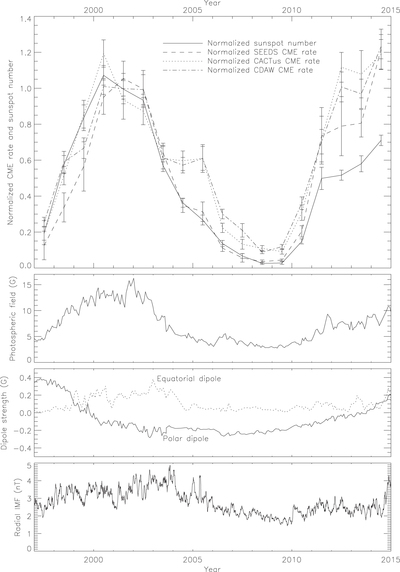
Caption: Figure 11.
Normalized annual average daily CME rates (top panel) from SEEDS, CACTus, and CDAW, including only detections with angular widths >30°, for the years 1997–2014. All poor and very poor cases have been excluded from the CDAW data. The normalized average monthly sunspot number is overplotted in dashed curves for comparison. The CME rates have been normalized by their average values during the cycle 23 maximum years 2000–2002. Thus, the plot shows the divergence of their evolution since the cycle 23 maximum. The second panel shows the total photospheric magnetic flux from NSO KPVT and SOLIS/VSM synoptic magnetograms. The third panel shows the polar and equatorial dipole components of the same synoptic magnetograms. The bottom panel shows the OMNI 2 radial magnetic field component at 1 AU.
Other Images in This Article
Copyright and Terms & Conditions
© 2015. The American Astronomical Society. All rights reserved.