Image Details
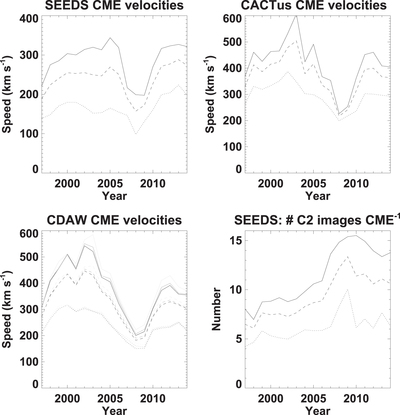
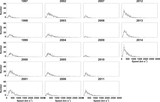
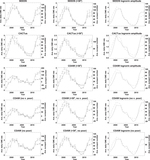
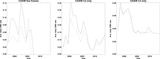
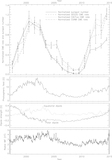
Caption: Figure 8.
Annual mean (solid lines), median (dashed lines). and mode (dotted lines) of the log-normal velocity distributions in Figures 1–4 plotted against time for SEEDS (top left), CACTUS (top right), and CDAW (bottom left) detections. Here, cases with angular widths <30° have been excluded from all databases. For CDAW data, the different shades of the curves represent calculations including “poor” and “very poor” detections (black), excluding “very poor” detections (dark gray) and excluding both “poor” and “very poor” detections (light gray). The bottom right plot shows the annual mean (solid lines), median (dashed lines), and mode (dotted lines) of the log-normal distributions of the annual SEEDS statistics for the number of LASCO C2 images per detected CME as functions of time.
Other Images in This Article
Copyright and Terms & Conditions
© 2015. The American Astronomical Society. All rights reserved.