

Image Details
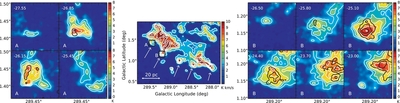
Caption: Figure 9.
Close-up of periodic drip-like structures along the GMC ridge. The central panel shows NANTEN 12CO(J = 1–0) data integrated over the velocity range −26.3 < vLSR < −23.0 km s−1. Both the color and the white contours show the same data, with the contour levels set at intervals of 2.5 K km s−1. White arrows mark the locations of drip-like features spaced at approximately equal projected distances along the bottom ridge of the cloud. The black boxes labeled "A" and "B" mark areas observed at higher resolution with the Mopra telescope. The right and left panels show velocity channel maps of this higher resolution data. The colored images and white contours are 12CO(J = 1–0), and black contours are 13CO(J = 1–0). Contour levels begin at 2.5 K and are incremented every 1.0 K for 12CO, and begin at 0.8 K incremented every 0.5 K for 13CO. Numbers in the top left corner of each sub-panel indicate the central velocity of the displayed channel.
Other Images in This Article
Copyright and Terms & Conditions
© 2015. The American Astronomical Society. All rights reserved.

