

Image Details
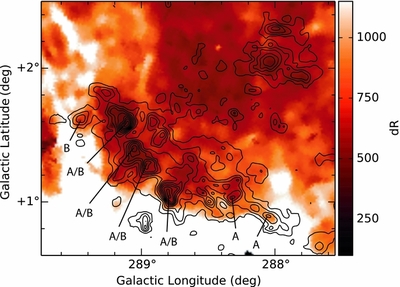
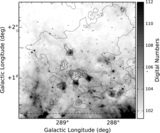
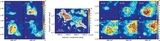
Caption: Figure 3.
13CO(J = 1–0) contours overlaid on an Hα intensity map from the SHASSA survey (Gaustad et al. 2001). Contours are velocity-integrated intensity, integrated over all velocity channels where 12CO was detected at the 3σ level, drawn at intervals of 1.0 K km s−1 and beginning at 0.5 K km s−1. Note that the GMC is seen in absorption against the Hα. Emission peaks labeled "A" and "B" indicate those that are best interpreted as primarily associated with GSH 287+04–17 and the OB2 supershell, respectively. Peaks labeled "A/B" are either broad/complex profiles showing evidence of association with both objects, or show one component associated with each shell. The units of the image are deci-Rayleighs (dR).
Other Images in This Article
Copyright and Terms & Conditions
© 2015. The American Astronomical Society. All rights reserved.

