

Image Details
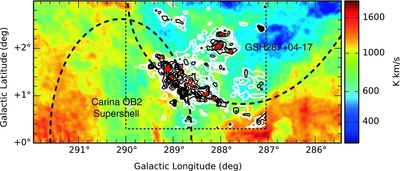
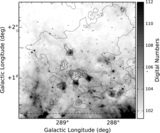
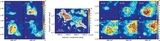
Caption: Figure 1.
Anatomy of the G288.5+1.5 region. The color image shows H I data from Dawson et al. (2011b), integrated over the velocity range of the GMC (−33 < vLSR < −11 km s−1). White contours are NANTEN 12CO(J = 1–0) integrated over the same velocity range, beginning at 4.0 K km s−1 and incremented every 5.0 K km s−1 thereafter. Black contours are 13CO(J = 1–0) velocity-integrated intensity, integrated over all velocity channels where 12CO was detected at the 3σ level, and drawn at intervals of 1.0 K km s−1. Red contours are C18O(J = 1–0) velocity-integrated intensity, integrated over all velocity channels where 13CO was detected at the 3σ level, beginning at 0.3 K km s−1 and incremented every 0.1 K km s−1 thereafter. The thin dashed line marks the limits of the region observed in CO. The thick dashed lines mark the locations of the H I supershells. For GSH 287+04–17 this line is a by-eye fit to the widest extent of the shell, which is delineated in part by the bright ridge of the GMC (see Dawson et al. 2008b). For the Carina OB2 supershell the line is an ellipse approximating the dimensions of the H I shell (Rizzo & Arnal 1998) and should be considered only a very rough representation of its true shape.
Other Images in This Article
Copyright and Terms & Conditions
© 2015. The American Astronomical Society. All rights reserved.

