

Image Details
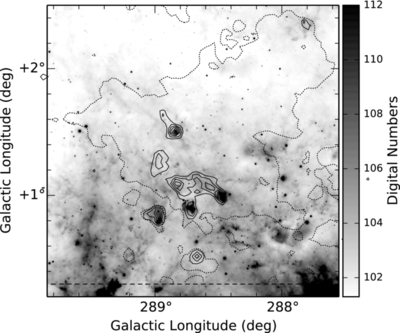
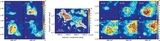
Caption: Figure 5.
WISE (Wright et al. 2010) 22 μm grayscale image of the region around the GMC, showing the warm dust indicative of star formation activity. The dotted contours show 12CO(J = 1–0) emission integrated over the full velocity extent of the GMC (−33 < vLSR < −10 km s−1), at a level of 3.5 K km s−1. Black contours are 13CO(J = 1–0) emission limited to the velocity range in which the gas shows good spatial correlation with the dust emission (−16.1 < vLSR < −10.4 km s−1). These contours are drawn every 0.6 K km s−1. It can be seen that the four compact 13CO clumps show a strong correlation with the only bright 22 μm features in the region, but that the majority of the GMC shows little evidence for localized gas heating. The dashed line marks the extent of the observed region.
Other Images in This Article
Copyright and Terms & Conditions
© 2015. The American Astronomical Society. All rights reserved.

