

Image Details
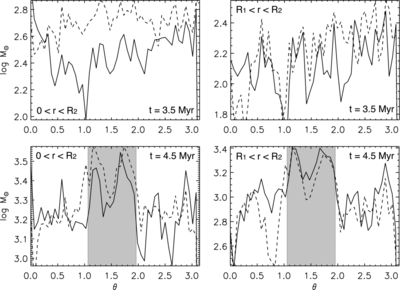
Caption: Figure 8.
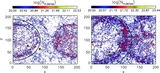
Dense gas mass (nH > 100 cm−3) in azimuthal bins (θ to θ + dθ) as a function of the angle θ around the center of the simulated bubbles, as derived directly from the column density maps in Figure 7. Solid lines show results for the left-hand bubble and dashed lines for the right-hand bubble. The top panels show plots for the early stage snapshot (3.5 Myr) and the bottom panel for the post-collision snapshot (5.5 Myr). The left-hand panels show the mass contained in "pie slices" of radius 0 to R2 (as indicated in Figure 7), while on the right only the mass in a ring from R1 to R2 is calculated. Gray shaded areas mark the approximate location of the collision zone. These plots are for the pure hydrodynamic run only, since the results from the self-gravitating run are almost identical.
Other Images in This Article
Copyright and Terms & Conditions
© 2015. The American Astronomical Society. All rights reserved.

