

Image Details
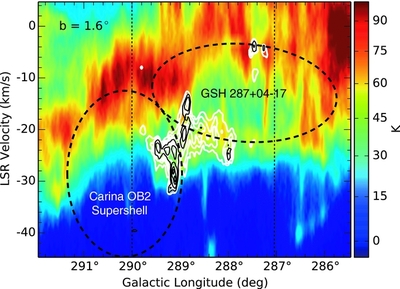
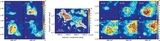
Caption: Figure 2.
Longitude–velocity plot of the G288.5+1.5 region, averaged over a latitude width of 10 arcmin, centered on b = 1 6. The color image shows H I and the white and black contours show 12CO(J = 1–0) and 13CO(J = 1–0). The dashed ellipses mark the expanding supershells. For GSH 287+04–17 the ellipse is a least squares fit to the H I and CO intensity peaks taken directly from Dawson et al. (2008b). For the Carina OB2 supershell, the ellipse is an approximation computed from the idealized dimensions, position, and expansion velocity of the shell given in Rizzo & Arnal (1998). Here, the line-of-sight expansion velocity is scaled to reflect the offset between this latitude slice and the shell centroid (b = 02), under the assumption that the depth of the shell along the line of sight is equal to its minor axis parallel to the Galactic plane.
Other Images in This Article
Copyright and Terms & Conditions
© 2015. The American Astronomical Society. All rights reserved.

