Image Details
Caption: Figure 3.
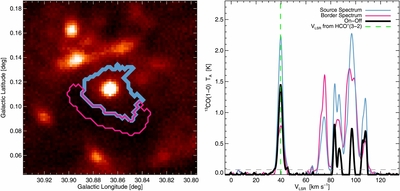
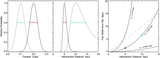
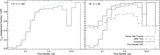
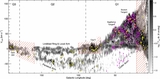
Demonstration of the morphological spectrum extraction technique for example source G030.866+00.115. Left: the image depicts the BGPS V2 flux density on a linear scale from −0.10 to 1.40 Jy beam−1. The blue contour is the Bolocat source outline, as described in Rosolowsky et al. (2010a), and the pink contour depicts the off-source region, one GRS resolution element in width, excluding pixels associated with the continuum sources above and to the lower right. Right: the filtered 13CO(1–0) spectra for this object. Blue and pink spectra represent the Ton(v) and Toff(v), respectively, while black represents Tsource(v), used to estimate the vLSR of the denser gas associated with the molecular cloud clump. The vertical green dashed line marks the HCO (3–2) vLSR from S13.
Other Images in This Article
Show More
Copyright and Terms & Conditions
© 2015. The American Astronomical Society. All rights reserved.