Image Details
Caption: Figure 2.
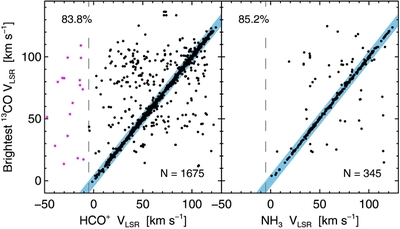
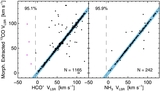
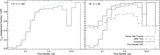
Comparison of the vLSR of the brightest 13CO emission feature from the GRS data toward a BGPS object compared to the (left) HCO (3–2) velocities of Shirley et al. (2013) and (right) NH3(1,1) velocities of Dunham et al. (2011b). The vertical gray dashed line in each panel represents the lower vLSR bound of GRS observations. Objects depicted in pink (vLSR <5 km s−1) would, therefore, not be detectable in the GRS data. The light blue region marks the |ΔvLSR | ⩽ 5 km s−1 used to compute the matching statistic shown at the top of each panel.
Other Images in This Article
Show More
Copyright and Terms & Conditions
© 2015. The American Astronomical Society. All rights reserved.
Copyright ©
2024 Astronomy Image Explorer. All Rights Reserved.