Image Details
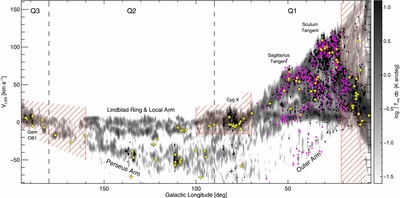
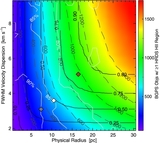
Caption: Figure 10.
Longitude–velocity diagram for the BGPS. Background image is the latitude-integrated 12CO intensity of Dame et al. (2001). Black circles mark the locations of BGPS V2 sources, and magenta squares identify the H II regions from Table 2. Yellow stars mark the trigonometric parallax measurements presented in Table 1 of Reid et al. (2014). The kinematic avoidance zones discussed in Section 3.2.2 are shown as hashed regions. Various Galactic features are identified.
Other Images in This Article
Show More
Copyright and Terms & Conditions
© 2015. The American Astronomical Society. All rights reserved.
Copyright ©
2024 Astronomy Image Explorer. All Rights Reserved.