Image Details
Caption: Figure 9.
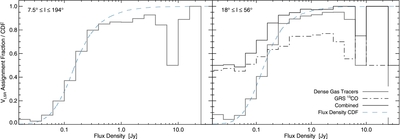
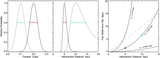
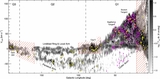
Assignment of vLSR as a function of λ = 1.1 mm peak flux density. The blue dashed curve in each panel represents the cumulative distribution of flux densities for that subset of sources. Left: velocity assignment fraction for the collection of dense-gas tracers discussed in Section 2.2 over the longitude range of Shirley et al. (2013). The dips in assignment fraction at S1.1 ![]() 4 Jy are due to multiple detected velocity components, new V2 sources on the edge of mosaic panels, or source boundary shifts between the V1 and V2.1 catalogs. Right: Galactic longitude further limited to the GRS coverage. Velocity assignment fractions of dense-gas tracers (solid gray) and morphologically extracted 13CO spectra (dot–dashed black) are shown, along with the combined velocity assignment fraction (solid black).
4 Jy are due to multiple detected velocity components, new V2 sources on the edge of mosaic panels, or source boundary shifts between the V1 and V2.1 catalogs. Right: Galactic longitude further limited to the GRS coverage. Velocity assignment fractions of dense-gas tracers (solid gray) and morphologically extracted 13CO spectra (dot–dashed black) are shown, along with the combined velocity assignment fraction (solid black).
Other Images in This Article
Show More
Copyright and Terms & Conditions
© 2015. The American Astronomical Society. All rights reserved.