Image Details
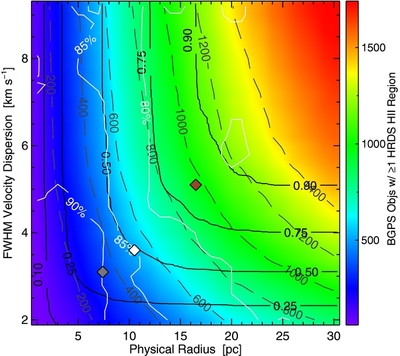
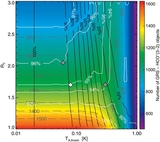
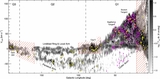
Caption: Figure 8.
Optimization of the association volume for catalog-based priors, based on HRDS H II regions. Background color scale and gray dashed contours denote the number of BGPS V2 objects falling within the association volume of one or more HRDS H II region, given the Ra and Δva indicated. Black contours show the bivariate cumulative distribution function for R and Δv for 749 GRS clouds from Roman-Duval et al. (2010), where the values shown indicate the fraction of clouds whose physical properties are both smaller than the axes values at that point. White contours mark the fraction of BGPS sources whose EMAF-derived distances and H II region-derived distances agree to better than 1 kpc. The white diamond indicates the chosen values of Ra and Δva while the brown and gray diamonds are discarded choices (see text).
Other Images in This Article
Show More
Copyright and Terms & Conditions
© 2015. The American Astronomical Society. All rights reserved.