Image Details
Caption: Figure 11.
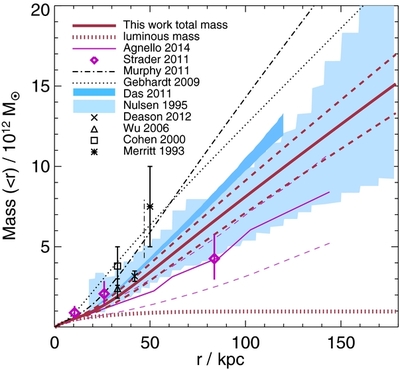
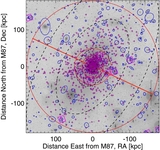
Mass profile of M87. The red solid and dashed lines indicate our total mass and its uncertainties. Our luminous mass profile is plotted with the red dotted line, while the width represents its uncertainty. The black dash-dotted line is the mass profile from M2011 and was constrained from VIRUS-p data extending to ~19 kpc and GCs extending to 45 kpc. The black dotted line is the mass profile from G2009 and was constructed using SAURON data and the same GCs as M2011. The vertical thin dash-dotted line over the G2009 and M2011 profile indicates the position r = 45 kpc, and both the M2011 and G2009 mass profiles outside of this position are extrapolated from their models. The magenta "◊"s indicate the mass obtained by Strader et al. (2011) by Jeans analysis using their new GCs combining the old GCs in literatures. The magenta solid (dashed) line is the mass (uncertainties) obtained by Agnello et al. (2014) with the same data as Strader et al. (2011). The blue solid region is the mass profile and corresponding uncertainties derived from X-ray gas kinematics based on Chandra and XMM-Newton observations (Das et al. 2010), while the very light blue region is the mass and corresponding uncertainties from the early ROSAT observation (Nulsen & Bohringer 1995). The black circle, diamond, square, and star with error bars are the masses derived with different GC samples or different methods by Deason et al. (2012), Wu & Tremaine (2006), Cohen (2000), and Merritt & Tremblay (1993), respectively.
Other Images in This Article
Show More
Copyright and Terms & Conditions
© 2014. The American Astronomical Society. All rights reserved.