Image Details
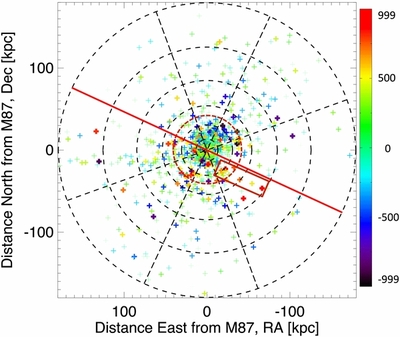
Caption: Figure 3.
Two-dimensional LOS velocity map for the 922 GCs within 180 kpc (before the number of GCs is reduced to 896 by 3σ clipping and substructure removal). R.A. and decl. are in units of kiloparsecs, and the red line indicates the orientation of the minor axis of M87. Each plus symbol represents a GC data point and the colors indicate the values of the velocities. The red dashed circle has radius R = 40.8 kpc and the red rectangle indicates a possible substructure. The color bar gives the velocity range in units of km s−1. The figure also illustrates the particle binning scheme for discrete data models. In this illustration, there are six radial and eight angular divisions with some discrete data points located in each bin. For our M2M models, we use 16 radial and 16 angular divisions.
Other Images in This Article
Show More
Copyright and Terms & Conditions
© 2014. The American Astronomical Society. All rights reserved.