Image Details
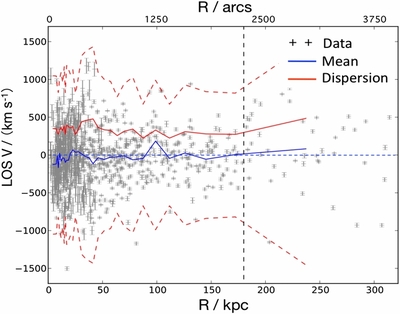
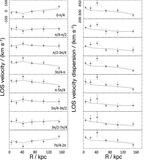
Caption: Figure 2.
GC LOS velocity distribution along the projected radius R. The blue solid line indicates the mean GC velocity profile, the red solid line shows the velocity dispersion, and the red dashed lines indicate the 3σ boundary of the velocity distribution. The blue dashed line represents v = 0. The vertical dashed line at R = 180 kpc indicates the radial limit of the data used in the M2M models.
Other Images in This Article
Show More
Copyright and Terms & Conditions
© 2014. The American Astronomical Society. All rights reserved.
Copyright ©
2025 Astronomy Image Explorer. All Rights Reserved.