Image Details
Caption: Figure 6.
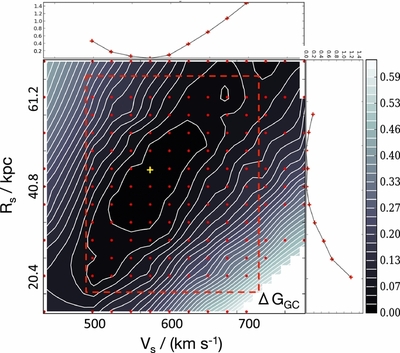
Constraints on Vs and Rs for M/LI = 6.37  . The dots indicates the parameter grid points we model, and the color bar shows the value of ΔGGC. The data points have not been smoothed but have been interpolated for plotting purposes. The yellow plus represents the best-fitting model obtained by model marginalization on Vs and Rs as shown in the side panels. The red rectangle indicates the grid points we model with the SAURON data.
Other Images in This Article
Show More
Copyright and Terms & Conditions
© 2014. The American Astronomical Society. All rights reserved.
Copyright ©
2025 Astronomy Image Explorer. All Rights Reserved.