Image Details
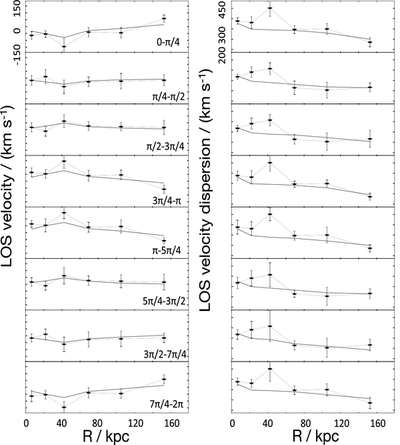
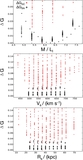
Caption: Figure 9.
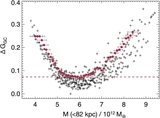
LOS mean velocity and velocity dispersion profiles. Each panel shows a profile along R in the specified direction. The zero angle represents the direction of the major axis. The blue dots with error bar are calculated from the GC data, and the solid lines are from the model. The velocity scales are shown at the top panels.
Other Images in This Article
Show More
Copyright and Terms & Conditions
© 2014. The American Astronomical Society. All rights reserved.
Copyright ©
2025 Astronomy Image Explorer. All Rights Reserved.