Image Details
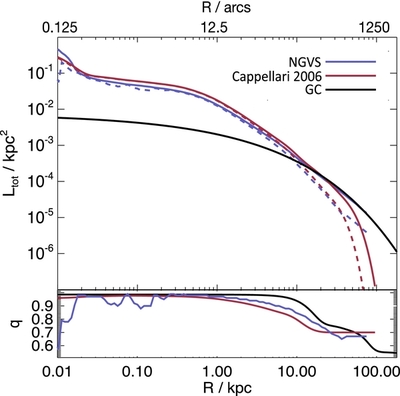
Caption: Figure 1.
Top: the normalized surface density profiles. The black line is the GC surface number density profile along projected radius from Peng et al. (2008), the red solid and dashed lines are the stellar surface brightness profile along major and minor axis constructed from the M87 MGE in Cappellari et al. (2006), the purple solid and dashed lines are the g band surface brightness profile along major and minor axis from NGVS (L. Ferrarese et al., in preparation). The total luminosity/number for each profile within 80 kpc have been normalized to be unity. Bottom: the minor to major axis ratio q of the GC surface number density, Cappellari et al. (2006) and NGVS stellar surface brightness, respectively.
Other Images in This Article
Show More
Copyright and Terms & Conditions
© 2014. The American Astronomical Society. All rights reserved.