Image Details
Caption: Figure 9.
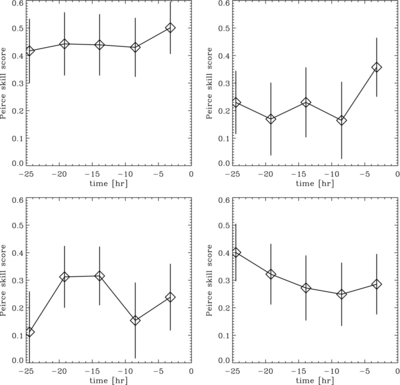
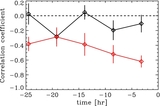
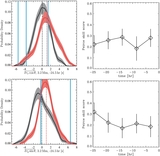
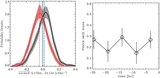
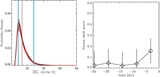
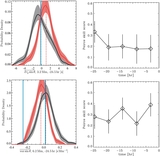
Evolution of the Peirce skill score for four variables: top left:
 , top right:
 in filter TD5, bottom left:
 in filter TD3, and bottom right:
 in filter TD3. Only regions with good data for all time intervals and seismology variables were used. Compared to the right
panels of Figures
1,
3,
5, in which all available regions were used in each plot, the same trends (or lack of trends) are seen, but with larger uncertainties.
in filter TD3. Only regions with good data for all time intervals and seismology variables were used. Compared to the right
panels of Figures
1,
3,
5, in which all available regions were used in each plot, the same trends (or lack of trends) are seen, but with larger uncertainties.
Other Images in This Article
Copyright and Terms & Conditions
© 2014. The American Astronomical Society. All rights reserved.