Image Details
Caption: Figure 2.
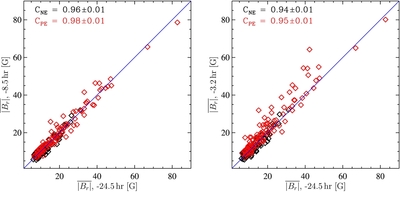
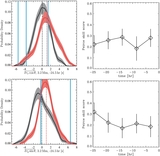
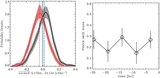
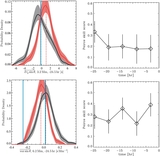
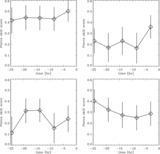
Left: scatter plot of
 for the time interval centered 24.5 hr before emergence vs. the time interval centered 8.5 hr before emergence for NE (black)
and PE (red) regions. The Pearson correlation coefficient between the PE at these times is 0.98 ± 0.01, whereas for the NE
it is 0.96 ± 0.01. Right: same scatter plot but between 24.5 hr and 3.2 hr before emergence. The correlation coefficients
are both slightly lower at 0.95 ± 0.01 for PE and 0.94 ± 0.01 for NE, suggesting that much of the evolution of the flux occurs
between 8.5 hr and 3.2 hr before emergence, which is consistent with the emergence process beginning (for some regions) during
the final 6 hr before the time of emergence.
for the time interval centered 24.5 hr before emergence vs. the time interval centered 8.5 hr before emergence for NE (black)
and PE (red) regions. The Pearson correlation coefficient between the PE at these times is 0.98 ± 0.01, whereas for the NE
it is 0.96 ± 0.01. Right: same scatter plot but between 24.5 hr and 3.2 hr before emergence. The correlation coefficients
are both slightly lower at 0.95 ± 0.01 for PE and 0.94 ± 0.01 for NE, suggesting that much of the evolution of the flux occurs
between 8.5 hr and 3.2 hr before emergence, which is consistent with the emergence process beginning (for some regions) during
the final 6 hr before the time of emergence.
Other Images in This Article
Copyright and Terms & Conditions
© 2014. The American Astronomical Society. All rights reserved.