Image Details

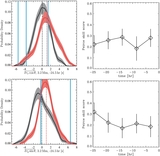
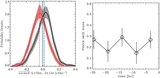
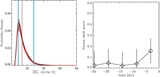
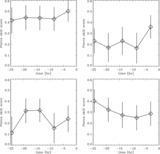
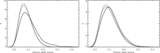
Caption: Figure 8.
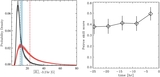
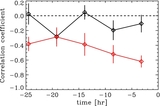
Nonparametric discriminant analysis for antisymmetric averages of the north–south travel-time differences,
 , in filter TD3 (top), and for the vertical vorticity,
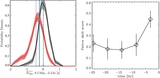
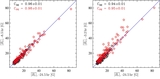
 , in filter TD4 (bottom), for a subset of regions with matched distributions of average magnetic flux in the same format as
Figure
1. The results are qualitatively very similar to those seen in Figures
5 (bottom) and
6 for the full samples. The largest change is an increase in the uncertainties caused by the smaller sample sizes.
, in filter TD4 (bottom), for a subset of regions with matched distributions of average magnetic flux in the same format as
Figure
1. The results are qualitatively very similar to those seen in Figures
5 (bottom) and
6 for the full samples. The largest change is an increase in the uncertainties caused by the smaller sample sizes.
Other Images in This Article
Copyright and Terms & Conditions
© 2014. The American Astronomical Society. All rights reserved.