Image Details
Caption: Figure 1.
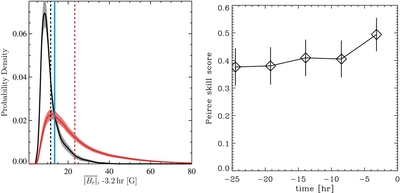
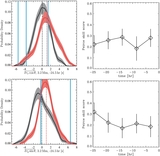
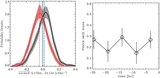
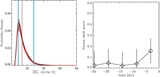
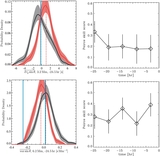
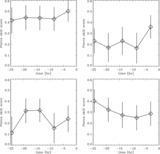
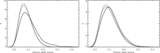
Nonparametric discriminant analysis for the mean unsigned magnetic flux,
 . Left: probability density estimates for the NE regions (black), and the PE regions (red) in time interval 4, centered 3.2 hr
before the emergence time, with the mean of each sample indicated by a vertical dashed line in the corresponding color. The
shaded region is a 1σ estimate of the uncertainty. The discriminant boundary, where the two probability density estimates
are equal, is indicated by a vertical blue line; an observation to the right of the boundary would be classified as an emergence.
There is an obvious difference between the density estimates for the NE and PE regions: the PE distribution has a longer tail
to high field strength, but there is also considerable overlap of the distributions. Right: evolution of the Peirce skill
score. There is perhaps a weak increase in the performance of
. Left: probability density estimates for the NE regions (black), and the PE regions (red) in time interval 4, centered 3.2 hr
before the emergence time, with the mean of each sample indicated by a vertical dashed line in the corresponding color. The
shaded region is a 1σ estimate of the uncertainty. The discriminant boundary, where the two probability density estimates
are equal, is indicated by a vertical blue line; an observation to the right of the boundary would be classified as an emergence.
There is an obvious difference between the density estimates for the NE and PE regions: the PE distribution has a longer tail
to high field strength, but there is also considerable overlap of the distributions. Right: evolution of the Peirce skill
score. There is perhaps a weak increase in the performance of
 closer to the emergence time that is likely due to the onset of emergence during time interval 4 for some regions, but for
most of the time intervals shown, the skill score is approximately constant.
closer to the emergence time that is likely due to the onset of emergence during time interval 4 for some regions, but for
most of the time intervals shown, the skill score is approximately constant.
Other Images in This Article
Copyright and Terms & Conditions
© 2014. The American Astronomical Society. All rights reserved.