Image Details
Caption: Figure 3.
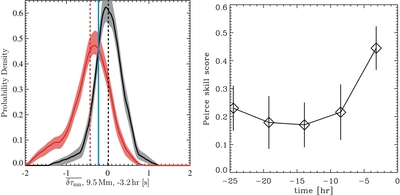
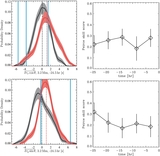
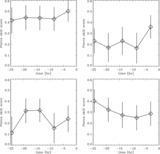
Nonparametric discriminant analysis for the mean travel-time shift,
 , in filter TD5, in the same format as Figure
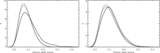
1. Left: there is an obvious difference between the density estimates for the NE and PE regions in the time interval centered
3.2 hr before the emergence time, with the PE regions typically having negative mean travel-time shifts. Right: the performance
of
, in filter TD5, in the same format as Figure
1. Left: there is an obvious difference between the density estimates for the NE and PE regions in the time interval centered
3.2 hr before the emergence time, with the PE regions typically having negative mean travel-time shifts. Right: the performance
of
 shows a similar trend to
 , constant for most of the time considered, with an increase at the last time interval, although the skill score is consistently
lower for
, constant for most of the time considered, with an increase at the last time interval, although the skill score is consistently
lower for
 .
.
Other Images in This Article
Copyright and Terms & Conditions
© 2014. The American Astronomical Society. All rights reserved.