Image Details
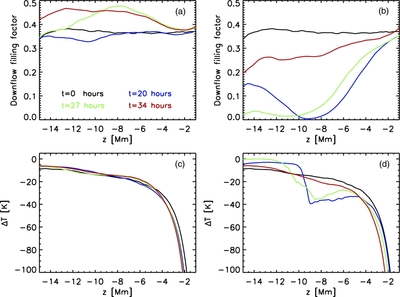
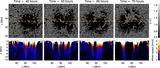
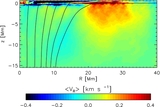
Caption: Figure 6.
Panels (a) and (b): vertical profiles of downflow filling factors. Panels (c) and (d): temperature difference ΔT = Tdown − Tup between downflow and upflow regions. Except for the snapshot at t = 0 hr (black line), which is based on an average over the whole domain, the quantities are computed inside a cylinder with 25 Mm radius centered on the left spot (a) and (c) and right spot (b) and (d). In addition, we averaged 2 hr in time.
Other Images in This Article

Show More
Copyright and Terms & Conditions
© 2014. The American Astronomical Society. All rights reserved.
Copyright ©
2025 Astronomy Image Explorer. All Rights Reserved.