Image Details
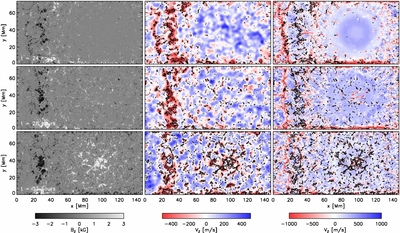
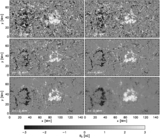
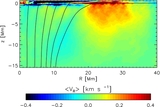
Caption: Figure 5.
Magnetograms at τ = 1 (left), smoothed vertical velocity at τ = 1 (middle), and vertical flow velocity in 8 Mm depth (right) for three different times during the spot formation phase (t = 24, 28, and 32 hr). In the velocity plots black contours indicate vertical magnetic field with more than 1.5 kG in the photosphere. Positive velocity values (blue colors) indicate upflows.
Other Images in This Article

Show More
Copyright and Terms & Conditions
© 2014. The American Astronomical Society. All rights reserved.
Copyright ©
2025 Astronomy Image Explorer. All Rights Reserved.