Image Details
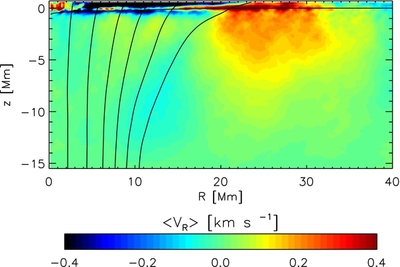
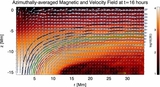
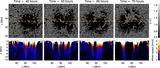
Caption: Figure 10.
Azimuthally averaged flows in the radial direction with respect to the approximate center of the right spot. The flows are in addition averaged in time from t = 40 to t = 70 hr, which corresponds to the nearly stationary phase in the spot evolution (Figure 2). Color shades indicate the radial velocity amplitude in the range from −400 to 400 m s−1, with red colors (positive values) indicating outflows away from the spot. We indicate the flux surfaces enclosing [0.05, 0.2, 0.4, 0.6, 0.8, 1] × 1022 Mx, the horizontal line indicates the τ = 1 level. The spot is surrounded by a region with outflowing material that extends to several Mm of depth and about two times the spot radius. The fasted velocities are found in the photosphere where they reach up to 600 m s−1.
Other Images in This Article

Show More
Copyright and Terms & Conditions
© 2014. The American Astronomical Society. All rights reserved.