Image Details
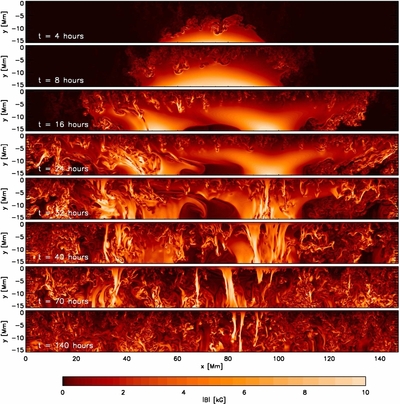
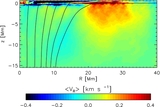
Caption: Figure 3.
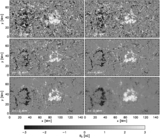
Time evolution of |B| on a vertical cut through the center of the domain along the x-axis. The first two snapshots show the subsurface field evolution prior the appearance of flux in the photosphere, the remaining six snapshots correspond to the photospheric magnetograms shown in Figure 1 (except for those at t = 28 and 30 hr).
(An animation and a color version of this figure are available in the online journal.)
The video/animation of this figure is available in the online journal.
Other Images in This Article

Show More
Copyright and Terms & Conditions
© 2014. The American Astronomical Society. All rights reserved.
Copyright ©
2025 Astronomy Image Explorer. All Rights Reserved.