Image Details
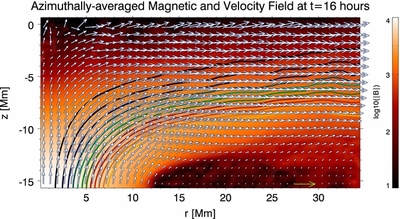
Caption: Figure 4.
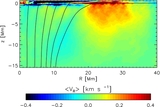
Subsurface structure of the developing right spot at t = 16 hr. The azimuthally averaged magnetic field is  shown in orange (
 in logarithmic scale from 10 G to 10 kG). The contour lines show flux surfaces enclosing flux content ranging from Φ = 1021 to Φ = 1.2 × 10²² Mx in intervals of ΔΦ = 1021 Mx. Overlaid vectors display components of the azimuthally averaged velocity field
  in the r–z plane. The yellow arrow at the bottom of the plot corresponds to 2 km s−1. The average flow field is roughly aligned with the average magnetic field, which loads the subsurface layers with buoyant, predominantly horizontal magnetic flux ready to emerge.
Other Images in This Article

Show More
Copyright and Terms & Conditions
© 2014. The American Astronomical Society. All rights reserved.