Image Details
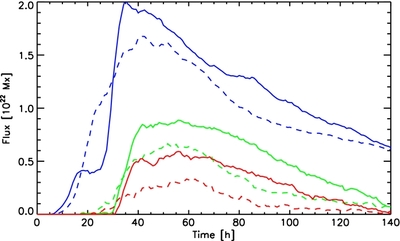
Caption: Figure 2.
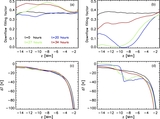
Time evolution of unsigned flux at τ = 1 (blue) as well as signed flux in regions with  (green) and
  (red). Solid lines correspond to the right spot and dashed lines correspond to the left spot.
Other Images in This Article

Show More
Copyright and Terms & Conditions
© 2014. The American Astronomical Society. All rights reserved.
Copyright ©
2025 Astronomy Image Explorer. All Rights Reserved.