Image Details
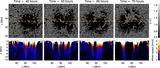
Caption: Figure 11.
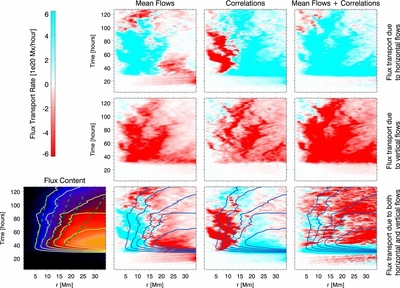
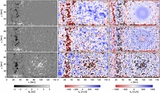
Transport of photospheric (z = 0) magnetic flux for the right (positive polarity) spot. The bottom left panel shows the net flux content within a circle of radius r from the axis of the right spot. The yellow contours correspond to enclosed net vertical fluxes of Φ = 2 × 10²¹ Mx to Φ = 1022 Mx in increments of ΔΦ = 2 × 10²¹ Mx. Green dashed lines in this panel show the migration of flux surfaces for a self-similar solution for the decay of an ideal spot due to turbulent diffusion. The remaining panels show the flux transport terms, with a positive (negative) value at radial distance r at a certain time t indicating that the flux Φ enclosed a circle of this radius is increasing (decreasing) in time. The column labeled "Mean Flows" shows the flux transport rate  , which is due to azimuthally averaged flow
  acting on the corresponding mean field
  . The column labeled "Correlations" shows
  due to correlations between fluctuating components v′ and B′. The first and second rows show components of
  associated with horizontal (i.e., lateral transport) and vertical flows (i.e., emergence and submergence), respectively. The third row shows the sum of both contributions. The plot in the bottom right shows
  multiplied by a factor of four to enhance contrast.
Other Images in This Article

Show More
Copyright and Terms & Conditions
© 2014. The American Astronomical Society. All rights reserved.