Image Details
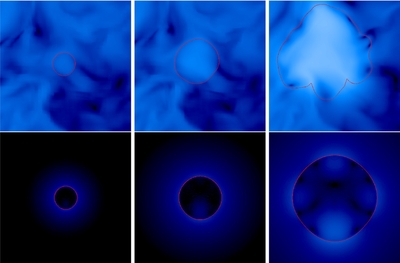
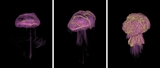
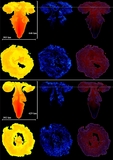
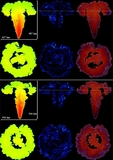
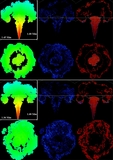
Caption: Figure 14.
Slices in the YZ plane for Models CV (top row) and C0 (bottom row) at t =0.1, 0.2, and 0.4 s, from left to right. The red line is the X(C 12) = 0.45 isocontour marking the flame surface. The color plot is the fluid speed, which spans, logarithmically, from less than 1 km s −1 (black) to 10 3 km s −1 (white). Note the lower maximum speed compared to Figure 13. The center of each panel is at the center of the white dwarf, and all panels have a spatial scale of 150 km on a side.
Other Images in This Article


Show More
Copyright and Terms & Conditions
© 2014. The American Astronomical Society. All rights reserved.
Copyright ©
2025 Astronomy Image Explorer. All Rights Reserved.